import pandas as pd
df = pd.read_excel("~/Desktop/weekprod2017tot.xls")
df = df.T
df.index = df.index.str.split("\n").map(lambda x: x[0])
df = df.iloc[0:-1]
df.loc["State"]
0                       Alabama
1                        Alaska
2                       Arizona
3                      Arkansas
4                      Colorado
5                      Illinois
6                       Indiana
7                Kentucky Total
8                  Eastern (KY)
9                  Western (KY)
10                    Louisiana
11                     Maryland
12                  Mississippi
13                     Missouri
14                      Montana
15                   New Mexico
16                 North Dakota
17                         Ohio
18                     Oklahoma
19           Pennsylvania Total
20              Anthracite (PA)
21              Bituminous (PA)
22                    Tennessee
23                        Texas
24                         Utah
25                     Virginia
26          West Virginia Total
27                Northern (WV)
28                Southern (WV)
29                      Wyoming
30            Appalachian Total
31               Interior Total
32                Western Total
33    East of Mississippi River
34    West of Mississippi River
35       Bituminous and Lignite
36                   Anthracite
37                   U.S. Total
Name: State, dtype: object
%matplotlib inline
df.columns = df.iloc[0]
df = df.drop("State", axis=0)
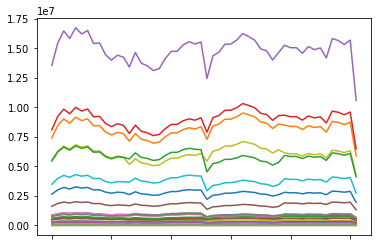
df[[x for x in df.columns if x not in ["Bituminous and Lignite", "Anthracite"]]].plot(legend=False)
<matplotlib.axes._subplots.AxesSubplot at 0x10e75a6d8>