8 years ago, I made this diagram tongue-in-cheek to show my colleagues that it was possible to write academic papers with Pandoc Markdown.
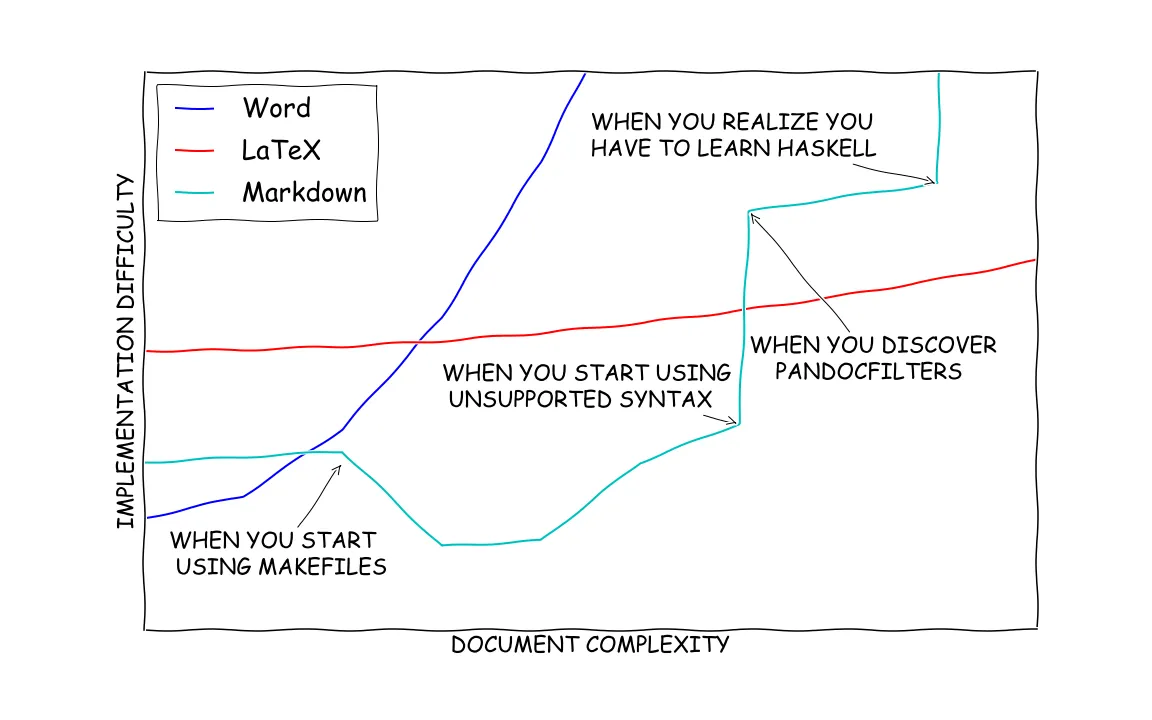
Since then, there's been a lot of improvements to the Pandoc Markdown workflow for writing papers. Pandoc went from 1.15.2 to 3.1.9, adding an extraordinary number of features. Of note, panflute was created as a better and more fun way to write Python Pandoc filters. And Pandoc embedded lua filters to allow writing pandoc filters directly in lua to prevent any marshalling of data.
Yet, Pandoc has not achieved widespread popularity in the academic sphere.
Collaborative academic writing often gravitates towards using Microsoft Word with OneDrive support. WYSIWYG is a powerful paradigm and provides immediate ease of use. Word's robust commenting and review tools are second to none. Outside of Word, OverLeaf or ShareLaTeX seem to have the most mindshare. I reckon when people choose , they tend to do so because it is a safe bet. As a markup language, it is older than I am. That means there are resources online to address pretty much any problem you will come across1 , there are templates everywhere for all kinds of publications, and text editor support is high quality.
I still believe Pandoc is a phenomenal piece of software for writing academic papers (or any technical content for that matter). Being able to version control through git, and to produce outputs in diverse formats like PDF, Word, and HTML, adds immense value for me. But is it really going to be easier for everyone I'm collaborating with?
Enter Quarto, a potential game-changer in persuading researchers to transition from Word or .
If this is the first time you've heard of Quarto, you are probably not alone. Quarto is a nascent open-source publishing system from the creators of RMarkdown and RStudio that builds upon Pandoc and Jupyter.
Quarto can embed Jupyter Notebook cells straight into the publication output. This allows for seamless integration of research and data analysis into the publication process. As most scientific research increasingly relies on interactive environments like RStudio and Jupyter Notebooks, Quarto's ability to incorporate this work into publishing workflows is immensely productive. And since it builds on top of Pandoc, Quarto supports extensions that are basically Lua filters to enhance the output. Quarto's VSCode extension makes it easier for even non-technical contributors to collaborate on writing.
For technical publications where you want to show results inline, I believe using Quarto is a no-brainer. If you are already using Jupyter Notebooks, using Quarto is incredibly seamless2. But even without using any of Quarto's computational features, I think it is a compelling alternative to many static site generation tools (e.g. Docsaurus, mkdocs, mdbook, hugo, sphinx, etc) as a means to develop high quality technical documentation. Over the past year, every report, paper, presentation, and tutorial I've created has used Quarto in one way or another. At the time of writing this post, Quarto is even the backbone of my blog.
Quarto isn't without its fair share of issues, and I do think for highly custom layouts or professional typesetting, directly working in is probably easier. But for such a young project, it shows real promise (in my humble opinion) and is worthy of giving it a shot.
Given that I've been using Quarto extensively for a while, I figured it was appropriate to revise the earlier diagram to reflect my experience:
Code
import matplotlibimport matplotlib.pyplot as pltimport numpy as np
ALPHA = 0.25
with plt.xkcd():    plt.rcParams.update({'font.size': 22})    x = np.arange(0, 1, 0.1)    word_y = 40 * x**2 + 2    latex_y = 2 * x**2 + 5    markdown_y = np.array([3, 3.1, 3.2, 1.5, 1.6, 3, 3.7, 7.5, 7.75, 8, 100])    markdown_x = np.array([0.0, 0.1, 0.2, 0.3, 0.4, 0.5, 0.6, 0.61, 0.7, 0.8, 0.9])    quarto_y = 22.5 * (x-0.3)**2 + 0.75    fig, axs = plt.subplots(1, 1, figsize=(16, 10))    ax = axs
    segment_positions = [0.25, 0.5, 0.75]
    segment_labels = ['Basic Reports OR\nStandard Documents', 'Papers with Figures\nbased on Results', 'Per-Page Layout\nOR Web Content', 'Professional\nBook Layout']
    range_starts = [0, 0.25, 0.5, 0.75]    range_ends = [0.25, 0.5, 0.75, 0.9]
    y_pos_annotations = -0.15    y_pos_arrows = -0.1
    for start, end, label in zip(range_starts, range_ends, segment_labels):        ax.annotate('',                    xy=(start, y_pos_arrows), xycoords=('data', 'axes fraction'),                    xytext=(end, y_pos_arrows), textcoords=('data', 'axes fraction'),                    arrowprops=dict(arrowstyle='<->', color='black'))
    for i, position in enumerate(segment_positions):        ax.axvline(x=position, color='black', linestyle='-.', linewidth=0.5, alpha = 0.5)
        ax.annotate(segment_labels[i],                    xy=(position, 0), xycoords=('data', 'axes fraction'),                    xytext=(-125, -50), textcoords='offset points',                    ha='center', va='baseline', alpha = 0.5)
    ax.annotate(segment_labels[-1],                xy=(1, 0), xycoords=('axes fraction', 'axes fraction'),                xytext=(-75, -50), textcoords='offset points',                ha='center', va='baseline', alpha = 0.5)
    word_line, = ax.plot(x, word_y, label="Word")    latex_line, = ax.plot(x, latex_y, label="LaTeX")    markdown_line, = ax.plot(markdown_x, markdown_y, alpha=ALPHA, label="Markdown")    quarto_line, = ax.plot(x, quarto_y, linewidth=5, label="Quarto")
    ax.legend(handles=[word_line, latex_line, markdown_line, quarto_line], loc="upper left")
    ax.set_ylim(0, 10)    ax.set_xlim(0, 0.9)
    arrowprops = dict(arrowstyle="->", alpha=ALPHA)    ax.annotate("WHEN YOU START\n USING MAKEFILES", xy=(0.2, 3.3), arrowprops=arrowprops, xytext=(0.025, 3.75), alpha = ALPHA/5)    ax.annotate("WHEN YOU START USING\n UNSUPPORTED SYNTAX", xy=(0.6, 3.7), arrowprops=arrowprops, xytext=(0.30, 4), alpha = ALPHA/5)    ax.annotate("WHEN YOU DISCOVER\n    PANDOCFILTERS", xy=(0.61, 7.5), arrowprops=arrowprops, xytext=(0.375, 6.25), alpha = ALPHA/5)    ax.annotate("WHEN YOU REALIZE YOU \nHAVE TO LEARN HASKELL", xy=(0.8, 8), arrowprops=arrowprops, xytext=(0.45, 8.5), alpha=ALPHA/5)
    ax.get_xaxis().set_ticks([])    ax.get_yaxis().set_ticks([])
    ax.set_xlabel("DOCUMENT COMPLEXITY")    ax.xaxis.set_label_position('top')    ax.set_ylabel("IMPLEMENTATION DIFFICULTY")
    plt.savefig("./images/learningcurve.png") #| hide_line
None #| hide_line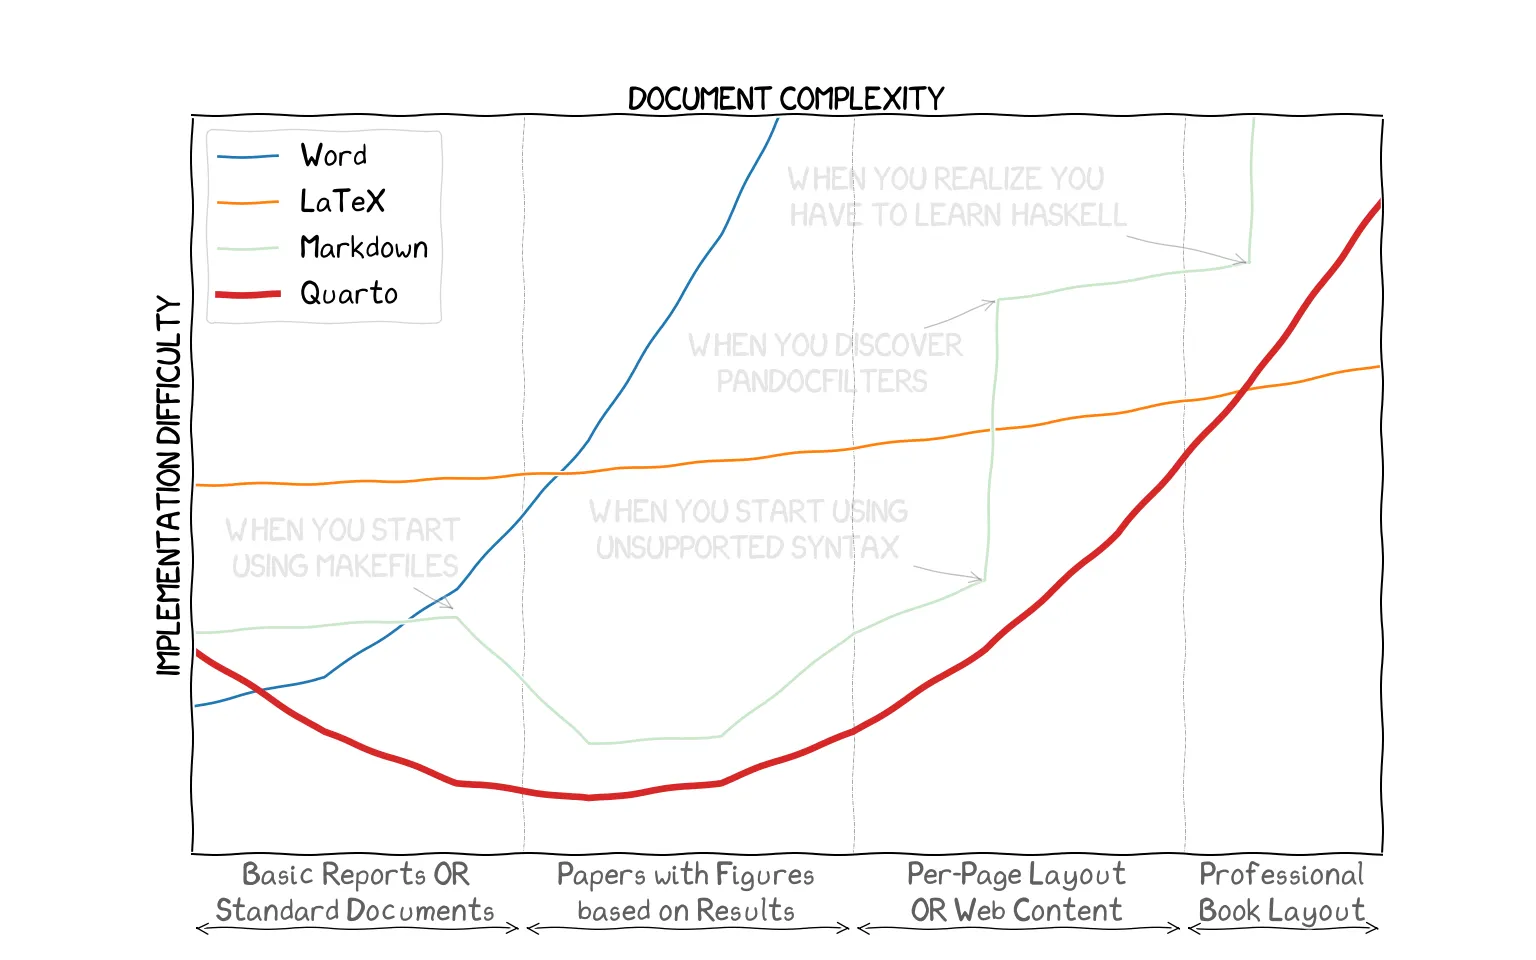
I hope this brief exploration into Quarto's and Pandoc's capabilities has been insightful. I'm happy to any questions in the comments below.
Footnotes
-
Pour one out if you've tasked a graduate student to figure out why your paper isn't compiling. ↩
-
aside: If you are interested in a static site generator written in Julia with a similar feature set, you should check out Franklin.jl. ↩