Text (720) 999-9476 with
"up", "down", "left" or "right"
to help the mouse get to the cheese
Interactive
Data Visualizations
with
Bokeh
Survey
- What plotting libraries do you use?
- What languages do you use?
Agenda
- What is Bokeh?
- Why Bokeh?
- Bokeh Live Demo
- So how does Bokeh work?
- How Bokeh compares to ...
- Getting started with Bokeh
- Additional features of Bokeh
What is Bokeh?

Bokeh is the aesthetic quality of the blur produced in the out-of-focus parts of an image produced by a lens.
"allows users the flexibility to focus on the most important data without losing track of the rich context that allows it to be understood."
So what is Bokeh?

Bokeh ...
- is a data visualization library
- Not unlike ggplot2, matplotlib, d3.js
- is built for the web
- has strong ties to data science
Examples

|

|

|

|

|

|

|

|

|

|

|

|

|

|

|

|

|

|

|

|

|
Why Bokeh?
Available in Python, R

Works with small to medium sized data
Real time two way server side interaction
Bokeh Live Demo
Install Bokeh
### Install Anaconda/Miniconda
### Open Terminal on Mac or Command Prompt on Windows
conda install bokeh
conda install jupyter # (optional but recommended)

# OR

### Install Anaconda/Miniconda/pip
### Open Terminal on Mac or Command Prompt on Windows
pip install bokeh
pip install jupyter # (optional but recommended)
Download notebooks or Clone repository
git clone https://github.com/kdheepak/interactive-data-visualizations-with-bokeh.git
cd interactive-data-visualizations-with-bokeh
cd notebooks
Live Demo #4 - Server Update in response to Client Selection
So how does Bokeh work?
- Dynamic plotting engine
- Consumes JSON to produce visualizations
- Can use websockets get/send updates
Bokeh Python
- Generates the JSON "scenegraph"
That's it!
from bokeh.plotting import figure
p = figure(width=300, height=300)
p.to_json(include_defaults=False)
{u'below': [{u'id': u'f06c6d6c-4f5f-498d-8c0e-1462aa483c72', u'type': u'LinearAxis'}],
 u'id': u'e5f5ef3e-308b-4f5d-9e0f-cf6cd7d9c3b6',
 u'left': [{u'id': u'5ebe63b6-f974-40bd-906e-38e4bbd3336c', u'type': u'LinearAxis'}],
 u'plot_height': 300, u'plot_width': 300,
 u'renderers': [{u'id': u'f06c6d6c-4f5f-498d-8c0e-1462aa483c72', u'type': u'LinearAxis'},
  {u'id': u'86e925b0-4f6f-43f4-8ccc-9231a87679f6', u'type': u'Grid'},
  {u'id': u'5ebe63b6-f974-40bd-906e-38e4bbd3336c', u'type': u'LinearAxis'},
  {u'id': u'13aca088-e607-468d-acdd-1b893480efd7', u'type': u'Grid'},
  {u'id': u'3a813ff1-4089-4ee5-967a-a3d85c104a1d', u'type': u'BoxAnnotation'}],
 u'title': {u'id': u'e23af6b7-6182-4264-b3ba-fe33afaf9a09', u'type': u'Title'},
 u'tool_events': {u'id': u'85db6e96-670c-4869-96b4-f3b43b5e0466', u'type': u'ToolEvents'},
 u'toolbar': {u'id': u'd0f28e52-7d97-4b23-8fa7-332c091551d1', u'type': u'Toolbar'},
 u'x_range': {u'id': u'25c6d0bd-b92d-4bb7-b1c4-762c6e6f8a48', u'type': u'DataRange1d'},
 u'y_range': {u'id': u'b786bc47-eb71-4f16-a2bc-06a0887d7092', u'type': u'DataRange1d'}}
Bokeh and HTML5 Canvas
//javascript
var c = document.getElementById("myCanvas");
var ctx = c.getContext("2d");
ctx.beginPath();
ctx.arc(95,50,40,0,2*Math.PI);
ctx.stroke();
BokehJS Models and Views

BokehJS is not actually JS
- Written primarily in CoffeeScript
- Bokeh Roadmap lists migration to TypeScript as a core improvement
Bokeh Server
- Uses websockets to allow real-time updates to visualizations
How does Bokeh compare to ...
- Static visualizations
- Low level event based interactivity available for native data exploration
- Extremely powerful framework, and others have built on top of it - Pandas, Seaborn
- Not well suited for the web currently - this will change after Matplotlib 2.0 JSON API is further developed
- Purely functional style programming
- Solves complicated math for the web
- Powerful SVG interaction and transition effects, and growing Canvas support
- v4 has made it modular, but backward incompatible
- Available as PlotlyJS
- Available in Python, R, MATLAB
- Great SVG interaction (built on d3) and WebGL support for 3-D plots
- Offline version available, although some features are behind a paywall
- Highly polished Grammar of Graphics interface
- Animation/interactivity using other libraries (gganimate, shiny)
A Dramatic Tour through Python's Data Visualization Landscape
Aside
Imperative vs Declarative
-
Imperative
interface: the "how"
- e.g. d3.js, matplotlib
-
Declarative
interface: the "what"
- e.g. seaborn, ggplot2, altair
Bokeh has both an imperative and a declarative interface.
# MATPLOTLIB
import matplotlib.pyplot as plt
import matplotlib
import matplotlib.cm as cm
import matplotlib.patches as patches

N = len(data['species'].unique())
cmap = cm.jet(pd.np.linspace(0, 1, num=N))
colors = {k: cmap[i] for i, k in enumerate(data['species'].unique())}

mmap = ['o', 's', '^']
markers = {k: mmap[i] for i, k in enumerate(data['species'].unique())}

data['color'] = data['species'].apply(lambda x: colors[x])
data['marker'] = data['species'].apply(lambda x: markers[x])

fig, ax = plt.subplots(1, 1, figsize=(7.5, 5))

artists = list()
legends = list()
for k in data['species'].unique():
    s = data.loc[data['species']==k]
    a = ax.scatter(s['petal_length'],
                    s['petal_width'],
                    marker=markers[k],
                    edgecolor=colors[k],
                    facecolor=colors[k])
    legends.append(k)
    artists.append(a)

ax.set_xlabel('petal_length')
ax.set_ylabel('petal_width')
ax.legend(artists, legends, loc='upper left')

from bokeh.charts import Scatter, output_notebook, show
scatter = Scatter(data, x='petal_length', y='petal_width',
                color='species', marker='species',
                title='Iris Dataset Color and Marker by Species',
                legend=True)
show(scatter)
Getting started with Bokeh
Bokeh High Level Interface
Bokeh Middle Level Interface
Bokeh Low Level Interface
One to one mapping between Python and Javascript models
Bokeh Source
Additional features of Bokeh
Bokeh Integration with DataShader

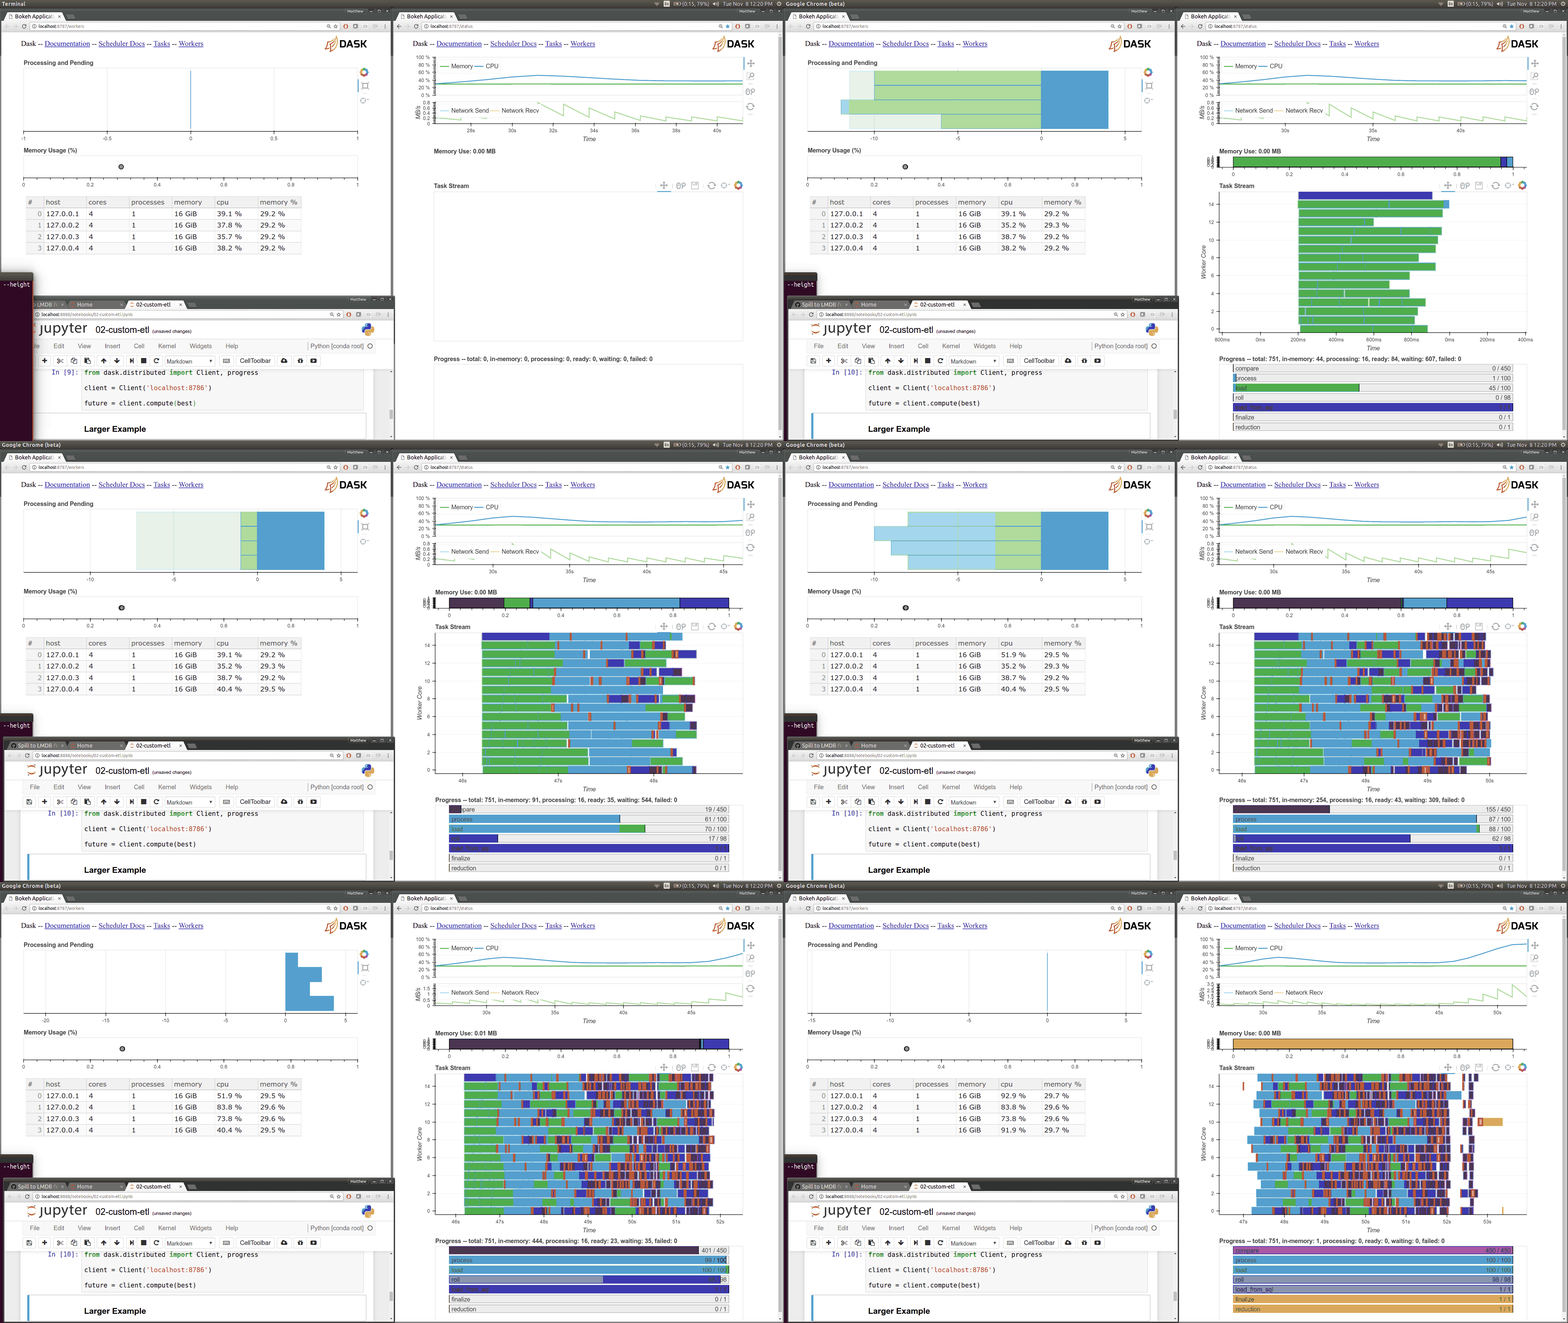
Bokeh Integration with Dask

Bokeh Integration with HoloViews
