Table of contents
Code
################################################################################
# autoreload all modules every time before executing the Python code%reload_ext autoreload%autoreload 2
################################################################################
from IPython.core.interactiveshell import InteractiveShell
# `ast_node_interactivity` is a setting that determines how the return value of the last line in a cell is displayed# with `last_expr_or_assign`, the return value of the last expression is displayed unless it is assigned to a variableInteractiveShell.ast_node_interactivity = "last_expr_or_assign"
################################################################################
import pandas as pd
# `copy_on_write` is a performance improvement# This will be the default in a future version of pandas# Refer to https://pandas.pydata.org/pandas-docs/stable/user_guide/copy_on_write.htmlpd.options.mode.copy_on_write = Truepd.options.future.no_silent_downcasting = True
################################################################################
%matplotlib inline
import matplotlib as mpl
mpl.use("agg")
# `constrained_layout` helps avoid overlapping elements# Refer to https://matplotlib.org/stable/tutorials/intermediate/constrainedlayout_guide.htmlmpl.pyplot.rcParams["figure.constrained_layout.use"] = TrueCode
import holoviews as hvimport hvplot.pandas  # noqaimport pandas as pdimport panel as pnimport param
pn.extension("tabulator")hv.extension("bokeh")
The panel library allows creating
interactive dashboards in pure Python. It's a flexible library that
allows interlinking matplotlib, bokeh, widgets, and more.
There are however many ways to use panel, some of which are better for
certain use cases. I wanted to write this post to share the way I use
panel.
Development Constraints
My first constraint when using panel was that I wanted to develop the
dashboard in an interactive manner, preferably using a Jupyter notebook
environment. panel does allow starting a server using the
panel serve --autoreload command and you can pass in the path to a
file or a jupyter notebook. However, I want to prototype individual
components in a Jupyter notebook, but once I'm happy with the
components, I want to combine them into a dashboard. With multiple
components like this, using global variables gets unwieldy.
Additionally, for multi-page dashboards, I don't want to have to store
different components in different files and run multiple servers.
My second constraint was that I wanted to make the dashboard as modular as possible. I wanted to be able to reuse some components across different dashboards. For example, I might have a component that shows a line chart and I want to use that line chart in a "user guide page" as well as in the "home page".
Lastly, I wanted the code to be usable in a Python script in case someone wanted to programmatically access the same features. Imagine if a user wanted to plot the line chart from the dashboard and annotate it with some custom text. I wanted to make it easy for an advanced user that wanted to do that to have the option to do so. This also means that I wanted to make it easy to test the components in a CI/CD pipeline.
The most natural way to do this was to make the components as classes and then instantiate them as part of the dashboard. This also requires the "state" and the "view" to be separate. In this post we are going to talk specifically about that approach. We'll use the IMDb movies dataset as an example to build a dashboard.
Jupyter prelude
When working in a Jupyter notebook, autoreloading modules is a feature that can be very useful. This means you can make a python package and import the package in the notebook, prototype components in the notebook and move the code over to the package when you are happy with the component. With autoreloading, you don't have to restart the jupyter notebook kernel every time you make a change to the source code.
# autoreload all modules every time before executing the Python code%reload_ext autoreload%autoreload 2For this example, I've made a package called movies_dashboard that has
the following structure:
!eza --tree srcsrc└── movies_dashboard ├── __init__.py ├── movies.py └── py.typedAny changes to the files in the package will be automatically reloaded when a new cell is run.
import movies_dashboard as mdmd.__version__AttributeError: module 'movies_dashboard' has no attribute '__version__'[0;31m---------------------------------------------------------------------------[0m[0;31mAttributeError[0m Traceback (most recent call last)Cell [0;32mIn[5], line 2[0m[1;32m 1[0m [38;5;28;01mimport[39;00m [38;5;21;01mmovies_dashboard[39;00m [38;5;28;01mas[39;00m [38;5;21;01mmd[39;00m[0;32m----> 2[0m [43mmd[49m[38;5;241;43m.[39;49m[43m__version__[49m
[0;31mAttributeError[0m: module 'movies_dashboard' has no attribute '__version__'That errors but after updating the version in the __init__.py file,
the __version__ attribute is updated without reloading the kernel.
!echo "__version__ = '0.1.0'" > src/movies_dashboard/__init__.pymd.__version__'0.1.0'Another setting that you can enable is last_expr_or_assign. This makes
it such that even if the last line of a cell is an assignment, the value
of the assignment is displayed.
from IPython.core.interactiveshell import InteractiveShellInteractiveShell.ast_node_interactivity = "last_expr_or_assign"With this setting, you don't have to repeat the name of the variable at the end of every cell to see the value of the variable.
import pandas as pd
df = pd.read_csv("./data/title.basics.tsv.gz", sep="\t", nrows=500).head()# df ## this line is not required to see the value of df
tconst titleType primaryTitle originalTitle \0 tt0000001 short Carmencita Carmencita1 tt0000002 short Le clown et ses chiens Le clown et ses chiens2 tt0000003 short Poor Pierrot Pauvre Pierrot3 tt0000004 short Un bon bock Un bon bock4 tt0000005 short Blacksmith Scene Blacksmith Scene
isAdult startYear endYear runtimeMinutes genres0 0 1894 \N 1 Documentary,Short1 0 1892 \N 5 Animation,Short2 0 1892 \N 5 Animation,Comedy,Romance3 0 1892 \N 12 Animation,Short4 0 1893 \N 1 ShortParam State
panel is built on top of param. One
useful way to think about these two packages is that param is a way to
define state and panel is a way to visualize that state. And making
state driven components is a great way to make interactive dashboards.
With param, you can define the state using a class based approach:
import param

class MoviesStateExample(param.Parameterized):    name = param.String()    year = param.Integer()
m = MoviesStateExample(name = "Goodfellas", year = 1990)
MoviesStateExample(name='Goodfellas', year=1990)And with panel, you can visualize the state:
import panel as pn
pn.Param(m)
Param(MoviesStateExample, name='Goodfellas', sizing_mode='stretch_width')When making any UI it is important to identify the state variables of a component. This usually involves understanding a few different things:
- What are the inputs to the component?
- What are the derived properties of the component?
- What are the outputs of the component?
This typically forms a unidirectional graph where the inputs are used to derive the properties and the properties are used to derive the outputs.
Identifying Inputs
Let's say we want to filter based on the year, the average ratings and the runtime of movies. In this case, we would have one variable for the input dataframe; and variables for the year, ratings and runtime ranges.
class MoviesStateExample(param.Parameterized):    input_df = param.DataFrame()
    year_range = param.Range()    ratings_range = param.Range()    runtime_range = param.Range()
Identifying Derived Properties
In this example, when the class is initialized, we may want to load the
CSV files, preprocess and clean the data. When self.df = df is called,
param will trigger an action with the name of the parameter. And any
functions that are listening to that action will be called. We can use
this feature to update any derived properties.
There are a few different ways to listen to changes in a parameter.
- Add a member function with the
param.dependsdecorator.
class MovieUsingDepends(param.Parameterized):    start_year = param.Integer()    end_year = param.Integer()    df = param.DataFrame()
    def __init__(self, **kwargs):        super().__init__(**kwargs)        self.df = pd.read_csv("./data/title.basics.tsv.gz", sep="\t", nrows=500)
    @param.depends("df", watch=True)    def _update_bounds(self):        self.start_year = int(self.df["startYear"].min())        self.end_year = int(self.df["startYear"].max())

m = MovieUsingDepends()print(dict(start=m.start_year, end=m.end_year))
{'start': 1892, 'end': 1912}- Use
pm.bindwith thewatch=Trueargument.
class MovieUsingBind(param.Parameterized):    start_year = param.Integer()    end_year = param.Integer()    df = param.DataFrame()
    def __init__(self, **kwargs):        super().__init__(**kwargs)        param.bind(self._update_bounds, self.param.df, watch=True)        self.df = pd.read_csv("./data/title.basics.tsv.gz", sep="\t", nrows=500)
    def _update_bounds(self, df):        self.start_year = int(self.df["startYear"].min())        self.end_year = int(self.df["startYear"].max())

m = MovieUsingBind()print(dict(start=m.start_year, end=m.end_year))
{'start': 1892, 'end': 1912}- Use
self.param.watchin the__init__function.
class MovieUsingWatch(param.Parameterized):    start_year = param.Integer()    end_year = param.Integer()    df = param.DataFrame()
    def __init__(self, **kwargs):        super().__init__(**kwargs)        self.param.watch(self._update_bounds, "df")        self.df = pd.read_csv("./data/title.basics.tsv.gz", sep="\t", nrows=500)
    def _update_bounds(self, event):        if event.name == "df":            df = event.new            self.start_year = int(self.df["startYear"].min())            self.end_year = int(self.df["startYear"].max())

m = MovieUsingWatch()print(dict(start=m.start_year, end=m.end_year))
{'start': 1892, 'end': 1912}In all cases, when you use watch=True, you have created a dependent
function, and any properties that are updated in that function are
dependent properties.
Outputs
Finally, it is important to define the outputs of the component. In this case, the outputs is a derived component that represents the filtered dataframe.
class MovieWithOutputs(param.Parameterized):    start_year = param.Integer()    end_year = param.Integer()    df = param.DataFrame()
    def __init__(self, **kwargs):        super().__init__(**kwargs)        self.df = pd.read_csv(            "./data/title.basics.tsv.gz",            sep="\t",            usecols=["primaryTitle", "startYear"],            nrows=200,        )
    @param.depends("df", watch=True)    def _update_bounds(self):        self.start_year = int(self.df["startYear"].min())        self.end_year = int(self.df["startYear"].max())
    @param.depends("df", "start_year", "end_year")    def output_df(self):        df, start_year, end_year = (            self.df,            self.start_year,            self.end_year,        )        return df.query(f"startYear >= {start_year}").query(f"startYear <= {end_year}")

m = MovieWithOutputs()m.output_df()| index | primaryTitle | startYear |
|---|---|---|
| 0 | Carmencita | 1894 |
| 1 | Le clown et ses chiens | 1892 |
| 2 | Poor Pierrot | 1892 |
| 3 | Un bon bock | 1892 |
| 4 | Blacksmith Scene | 1893 |
| .. | ... | ... |
| 195 | La fuite en Égypte | 1898 |
| 196 | Glasgow Fire Engine | 1898 |
| 197 | Gran corrida de toros | 1898 |
| 198 | Indian War Council | 1894 |
| 199 | Le jardin des oliviers | 1898 |
[200 rows x 2 columns]
Returning the outputs from a function allows for easy access to the outputs for testing, debugging and for use in other components.
On some occassions however, you might want to store the outputs as a
property to cache outputs. This is useful when the output is expensive
to compute. In the example below, the output is stored in a
filtered_df property and is updated whenever the df, start_year or
end_year changes.
class MovieWithDependentOutputs(param.Parameterized):    df = param.DataFrame()    start_year = param.Integer()    end_year = param.Integer()    filtered_df = param.DataFrame()
    def __init__(self, **kwargs):        super().__init__(**kwargs)        self.df = pd.read_csv(            "./data/title.basics.tsv.gz",            sep="\t",            usecols=["primaryTitle", "startYear"],            nrows=200,        )
    @param.depends("df", watch=True)    def _update_bounds(self):        self.start_year = int(self.df["startYear"].min())        self.end_year = int(self.df["startYear"].max())
    @param.depends("df", "start_year", "end_year", watch=True)    def _output_df(self):        df, start_year, end_year = (            self.df,            self.start_year,            self.end_year,        )        self.filtered_df = df.query(f"startYear >= {start_year}").query(            f"startYear <= {end_year}"        )

m = MovieWithDependentOutputs()m.filtered_df| index | primaryTitle | startYear |
|---|---|---|
| 0 | Carmencita | 1894 |
| 1 | Le clown et ses chiens | 1892 |
| 2 | Poor Pierrot | 1892 |
| 3 | Un bon bock | 1892 |
| 4 | Blacksmith Scene | 1893 |
| .. | ... | ... |
| 195 | La fuite en Égypte | 1898 |
| 196 | Glasgow Fire Engine | 1898 |
| 197 | Gran corrida de toros | 1898 |
| 198 | Indian War Council | 1894 |
| 199 | Le jardin des oliviers | 1898 |
[200 rows x 2 columns]
Conventions
One thing to consider is that some dependent properties may computed only as part of the internal state of a component. These dependent properties are usually "private" variables and are not meant to be accessed directly.
class MovieSignalingPrivateVariables(param.Parameterized):    df = param.DataFrame()    _start_year = param.Integer()    _end_year = param.Integer()    filtered_df = param.DataFrame()
    def __init__(self, **kwargs):        super().__init__(**kwargs)        self.df = pd.read_csv(            "./data/title.basics.tsv.gz",            sep="\t",            usecols=["primaryTitle", "startYear"],            nrows=200,        )
    @param.depends("df", watch=True)    def _update_bounds(self):        self._start_year = int(self.df["startYear"].min())        self._end_year = int(self.df["startYear"].max())
    @param.depends("df", "_start_year", "_end_year", watch=True)    def _update_outputs(self):        df, start_year, end_year = (            self.df,            self._start_year,            self._end_year,        )        self.filtered_df = df.query(f"startYear >= {start_year}").query(            f"startYear <= {end_year}"        )

m = MovieSignalingPrivateVariables();
Panel View
After setting up the state of an component, we can create a view that presents the state, derived values and the outputs.
One convention is to make this part of a panel() or a view() method
that returns the layout and initializes any pn.widgets in, and only
in, this method.
class MoviesPanel(param.Parameterized):    df = param.DataFrame()    start_year = param.Integer()    end_year = param.Integer()    filtered_df = param.DataFrame()
    def __init__(self, **kwargs):        super().__init__(**kwargs)        basics = pd.read_csv("./data/title.basics.tsv.gz", sep="\t", nrows=500)        ratings = pd.read_csv("./data/title.ratings.tsv.gz", sep="\t", nrows=500)        self.df = basics.merge(ratings, on="tconst").dropna()
    @param.depends("df", watch=True)    def _update_bounds(self):        self.start_year = int(self.df["startYear"].min())        self.end_year = int(self.df["startYear"].max())
    @param.depends("df", "start_year", "end_year", watch=True)    def _update_outputs(self):        df, start_year, end_year = (            self.df,            self.start_year,            self.end_year,        )        self.filtered_df = df.query(f"startYear >= {start_year}").query(            f"startYear <= {end_year}"        )
    def panel(self):        return pn.Column(            pn.Row(                pn.widgets.IntInput.from_param(self.param.start_year, name="Start Year"),                pn.widgets.IntInput.from_param(self.param.end_year, name="End Year"),            ),            pn.widgets.Tabulator.from_param(                self.param.filtered_df, pagination="remote", page_size=5, disabled=True,            ),        )

m = MoviesPanel()m.panel()
Column(sizing_mode='stretch_width') [0] Row(sizing_mode='stretch_width') [0] IntInput(name='Start Year', sizing_mode='stretch_width', value=1892) [1] IntInput(name='End Year', sizing_mode='stretch_width', value=1912) [1] Tabulator(disabled=True, name='Filtered df', page_size=5, pagination='remote', sizing_mode='stretch_width', value= tconst titleType ...)When a user updates the start year or the end year, the filtered
dataframe is updated. And when that filtered data is updated, the
Tabulator widget is updated. This is a very simple example, but this
pattern can be extended to more complex dashboards.
Every widget in panel accepts a few different types of arguments (See this section in the official documentation for more information). But the two most common types are:
- A Parameter instance
- A method using
pn.bindorpn.dependsthat returns a value
1. A parameter instance
It is important to understand the difference between an attribute instance and a parameter instance. An attribute instance is the value that most people typically deal with.
m.start_year1892A parameter instance on the other hand is a special instance created by
any class that inherits from param.Parameterized.
m.param.start_year<param.parameters.Integer at 0x317027400>isinstance(m.param.start_year, param.Parameter)TrueAttribute instances are implemented using descriptors. When the Python
interpreter sees m.start_year, it will return the value of the
attribute by called the __get__ method of the param.Integer
descriptor. This returns the current state at the time of the
invocation.
type(m.start_year)intm.param.start_year on the other hand is a special value that contains
a pm.Parameter instance that allows enabling the reactive features.
This special value has to be passed into a widget to create a two way
binding, and this has to be done using the from_param method.
pn.widgets.IntInput.from_param(m.param.start_year)IntInput(name='Start year', sizing_mode='stretch_width', value=1892)2. A method using pn.bind or pn.depends that returns a value
There are two ways to achieve a method that functions as a callback.
a. Using pn.bind
b. Using @pn.depends
a. Using pn.bind
Widgets also can accept a method that is bound to a parameter. This is useful when you want to create a widget that is dependent on another parameter.
def _get_dataframe(df):    return df.head().drop(columns=["tconst", "titleType", "isAdult", "endYear", "genres", "originalTitle"])
pn.widgets.Tabulator(pn.bind(_get_dataframe, m.param.filtered_df), disabled=True)
Tabulator(disabled=True, sizing_mode='stretch_width', value= p...)pn.bind is a way to bind a method to a parameter, and this method will
be called whenever the parameter changes.
Keep in mind that pn.bind returns a function:
type(pn.bind(_get_dataframe, m.param.filtered_df))functionAnd calling that function will return the value of the parameter at that time.
f = pn.bind(_get_dataframe, m.param.filtered_df);
f()
primaryTitle startYear runtimeMinutes averageRating numVotes0 Carmencita 1894 1 5.7 21151 Le clown et ses chiens 1892 5 5.6 2852 Poor Pierrot 1892 5 6.4 21483 Un bon bock 1892 12 5.3 1834 Blacksmith Scene 1893 1 6.2 2872But in Jupyter notebooks, even displaying the function will call the function and return the value.
f<function param.reactive.bind.<locals>.wrapped(*wargs, **wkwargs)>b. Using @pn.depends
The input to a widget can also be a function or a method that is part of
the class that uses the @pn.depends decorator. If this decorator is
used, and when this method is passed to a widget, the method will be
called whenever the parameter changes and the return value is used to
update the UI.
In this case however, displaying the method will not call the method:
@pn.depends(m.param.filtered_df)def _get_dataframe(filtered_df):    return df.head().drop(columns=["tconst", "titleType", "isAdult", "endYear", "genres", "originalTitle"])
_get_dataframe
<function __main__._get_dataframe(filtered_df)>_get_dataframe(m.filtered_df) primaryTitle startYear runtimeMinutes0 Carmencita 1894 11 Le clown et ses chiens 1892 52 Poor Pierrot 1892 53 Un bon bock 1892 124 Blacksmith Scene 1893 1When using @pn.depends, the variable (e.g. _get_dataframe) that
would have contained a reference to the function is replaced by a new
wrapped function which is "reactive". So in this case, you can pass the
variable directly to the widget.
pn.widgets.Tabulator(_get_dataframe, disabled=True)Tabulator(disabled=True, sizing_mode='stretch_width', value= p...)Here's an example of using the @pn.depends decorator to define a
method in a class that is used to update the UI:
class MoviesPanel(param.Parameterized):    start_year = param.Integer()    end_year = param.Integer()    df = param.DataFrame()    filtered_df = param.DataFrame()
    def __init__(self, **kwargs):        super().__init__(**kwargs)        basics = pd.read_csv("./data/title.basics.tsv.gz", sep="\t", nrows=500)        ratings = pd.read_csv("./data/title.ratings.tsv.gz", sep="\t", nrows=500)        self.df = basics.merge(ratings, on="tconst").dropna()
    @param.depends("df", watch=True)    def _update_bounds(self):        self.start_year = int(self.df["startYear"].min())        self.end_year = int(self.df["startYear"].max())
    @param.depends("df", "start_year", "end_year", watch=True)    def _output_df(self):        df, start_year, end_year = (            self.df,            self.start_year,            self.end_year,        )        self.filtered_df = df.query(f"startYear >= {start_year}").query(            f"startYear <= {end_year}"        )        return self.filtered_df
    @param.depends("filtered_df")    def _get_dataframe(filtered_df):        return df.head().drop(columns=["tconst", "titleType", "isAdult", "endYear", "genres", "originalTitle"])
    def panel(self):        return pn.Column(            pn.Row(                pn.widgets.IntInput.from_param(self.param.start_year, name="Start Year"),                pn.widgets.IntInput.from_param(self.param.end_year, name="End Year"),            ),            pn.widgets.Tabulator(                self._get_dataframe, pagination="remote", page_size=5            ),        )


m = MoviesPanel()m.panel()
Column(sizing_mode='stretch_width') [0] Row(sizing_mode='stretch_width') [0] IntInput(name='Start Year', sizing_mode='stretch_width', value=1892) [1] IntInput(name='End Year', sizing_mode='stretch_width', value=1912) [1] Tabulator(page_size=5, pagination='remote', sizing_mode='stretch_width', value= p...)watch=True vs watch=False
Notice that the @pn.depends decorator is used to define the method
_get_dataframe does not use the watch=True argument.
If the @pn.depends decorator uses the watch=True argument, the
method will be called whenever the parameter changes AND the method will
be called again when the widget needs to be updated.
If you are ever confused about this, add print or log statements to the method to see when a method is called.
class WatchTrueVsFalse(param.Parameterized):    input_data = param.String()
    @param.depends("input_data")    def _update_dependency_unwatched(self):        print("Unwatched")        return "Unwatched: " + self.input_data
    @param.depends("input_data", watch=True)    def _update_dependent_watched(self):        print("Watched")        return "Watched: " + self.input_data
    def panel(self):        return pn.Column(            pn.widgets.TextInput.from_param(self.param.input_data),            pn.Row(pn.pane.Str(self._update_dependency_unwatched), pn.pane.Str(self._update_dependent_watched)),        )
WatchTrueVsFalse(input_data="hello world").panel()UnwatchedWatchedColumn(sizing_mode='stretch_width') [0] TextInput(name='Input data', sizing_mode='stretch_width', value='hello world') [1] Row(sizing_mode='stretch_width') [0] Str(str, sizing_mode='stretch_width') [1] Str(str, sizing_mode='stretch_width')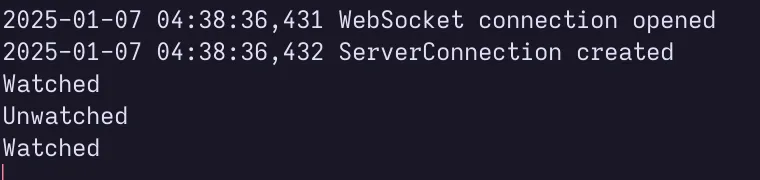
You can see that "Watched" is printed twice:
- When the input is changed
- When the pn.pane.Str is displayed again after the input is changed
but "Unwatched" is printed only once:
- When the pn.pane.Str is displayed again after the input is changed
Example: Movies Dashboard
With just the @param.depends decorator, you can make any reactive
component using panel by using two way bindings to update the state and
the UI, and trigger updates to other dependencies which in turn can
update other parts of the UI.
As a more involved example, I've attached a package with a class called
Movies that has the following state, derived properties and outputs:
//| code-fold: truedigraph MoviesGraph {    // Define graph properties    rankdir=LR;    node [shape=box, style=rounded];
    // State variables    nrows [label="nrows (state)"];    df [label="df (state)"];    year_range [label="year_range (state)"];    ratings_range [label="ratings_range (state)"];    runtime_range [label="runtime_range (state)"];    genre [label="genre (state)"];
    // Derived properties    filtered_df [label="filtered_df (derived)"];    plot [label="plot (derived)"];
    // Outputs    panel_layout [label="Panel Layout (output)"];
    // Edges    nrows -> df;    df -> year_range;    df -> ratings_range;    df -> runtime_range;    df -> genre;    df -> filtered_df;    year_range -> filtered_df;    ratings_range -> filtered_df;    runtime_range -> filtered_df;    genre -> filtered_df;    filtered_df -> plot;    plot -> panel_layout;    filtered_df -> panel_layout;}
And here's what the UI looks like:
Code
import movies_dashboardWe can instantiate the Movies class.
m = movies_dashboard.movies.Movies();And call the panel() method to get an interactive dashboard.
m.panel()Column(sizing_mode='stretch_width') [0] Row(sizing_mode='stretch_width') [0] RangeSlider(end=10, name='Ratings range', sizing_mode='stretch_width', step=1, value=(0, 10), value_end=10) [1] RangeSlider(end=2025, name='Year range', sizing_mode='stretch_width', start=1894, step=1, value=(1894, 2025), value_end=2025, value_start=1894) [2] RangeSlider(end=59460, name='Runtime range', sizing_mode='stretch_width', start=1, step=1, value=(1, 59460), value_end=59460, value_start=1) [1] Row(sizing_mode='stretch_width') [0] Select(name='Genre', options=OrderedDict({'Romance': 'R...]), sizing_mode='stretch_width', value='Romance') [2] Tabs(sizing_mode='stretch_width') [0] HoloViews(DynamicMap, height=400, name='Visualization', sizing_mode='fixed', width=900) [1] Tabulator(page_size=10, pagination='remote', sizing_mode='stretch_width', value= tconst t...)By having methods that return subcomponents, we can easily combine them on the fly on a case by case basis.
Code
m.genre = "Documentary"documentary_plot = m._update_plot()m.genre = "Comedy"comedy_plot = m._update_plot()
m.genre = "Romance"
(documentary_plot + comedy_plot).cols(1)
:Layout .BoxWhisker.I :BoxWhisker [startYear] (averageRating) .BoxWhisker.II :BoxWhisker [startYear] (averageRating)The only real disadvantage of this package based approach is that it is not straightforward to make a wasm only version of the panel dashboard, since that requires it to be all in one file.
This approach allows making a package, using param to define dependent
state, create UI when required in a class based approach. In my opinion,
this lends itself to better testing, documentation and maintainability
in the long run. This is also the approach recommended in the
intermediate sections of the panel tutorials. Check out these links
for more information:
- https://panel.holoviz.org/tutorials/intermediate/parameters.html
- https://panel.holoviz.org/tutorials/intermediate/interactivity.html
- https://panel.holoviz.org/tutorials/intermediate/reusable_components.html
I also wanted to shout out the panel and param developers for
creating such a flexible and powerful library. And thanks to the members
of the holoviz community for offering feedback and suggestions on this
post.